
🔹 **1. Simple Bar Diagram**
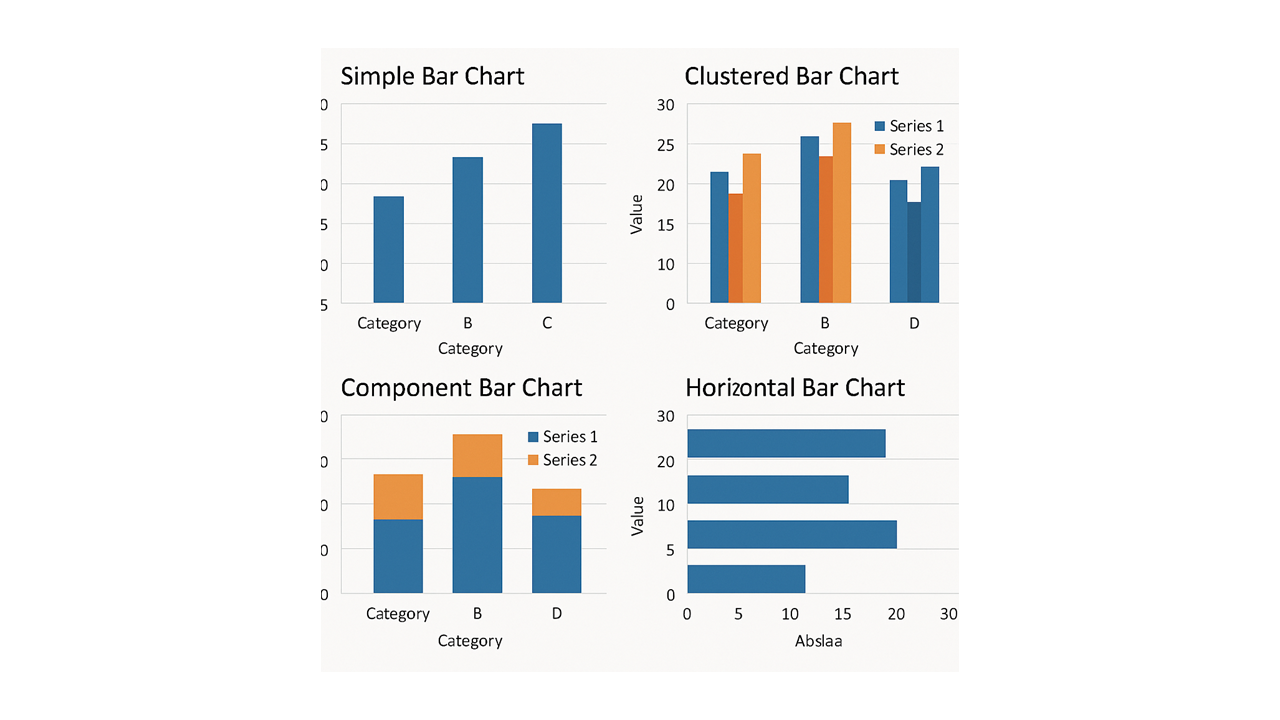
A simple bar diagram represents the frequency or percentage of a single categorical variable.
✅ **Example:** Distribution of study participants according to blood groups, educational status or disease severity.
📌 **Best used for:** Comparing frequencies or percentages across different categories.
🔹 **2. Clustered Bar Diagram (Multiple Bar Diagram)**
A clustered bar diagram displays two or more groups side by side within each category, allowing direct comparison.
✅ **Example:** Comparing the prevalence of hypertension among male and female participants across different age groups.
📌 **Best used for:** Comparing multiple groups across the same categories.
🔹 **3. Component Bar Diagram (Stacked Bar Diagram)**
A component bar diagram divides each bar into segments representing different subgroups contributing to the total.
✅ **Example:** Showing the distribution of mild, moderate and severe disease among patients in different treatment groups.
📌 **Best used for:** Demonstrating the composition of a total and comparing subgroup distributions.
🔹 **4. Horizontal Bar Diagram**
A horizontal bar diagram represents categories along the vertical axis and their corresponding frequencies or percentages along the horizontal axis.
✅ **Example:** Presenting different clinical symptoms, complications or reasons for hospital admission.
📌 **Best used for:** Variables with lengthy category names or numerous categories.
✔ Remember that bar diagrams are primarily used for categorical data, whereas histograms are used to display distributions of continuous numerical data.