
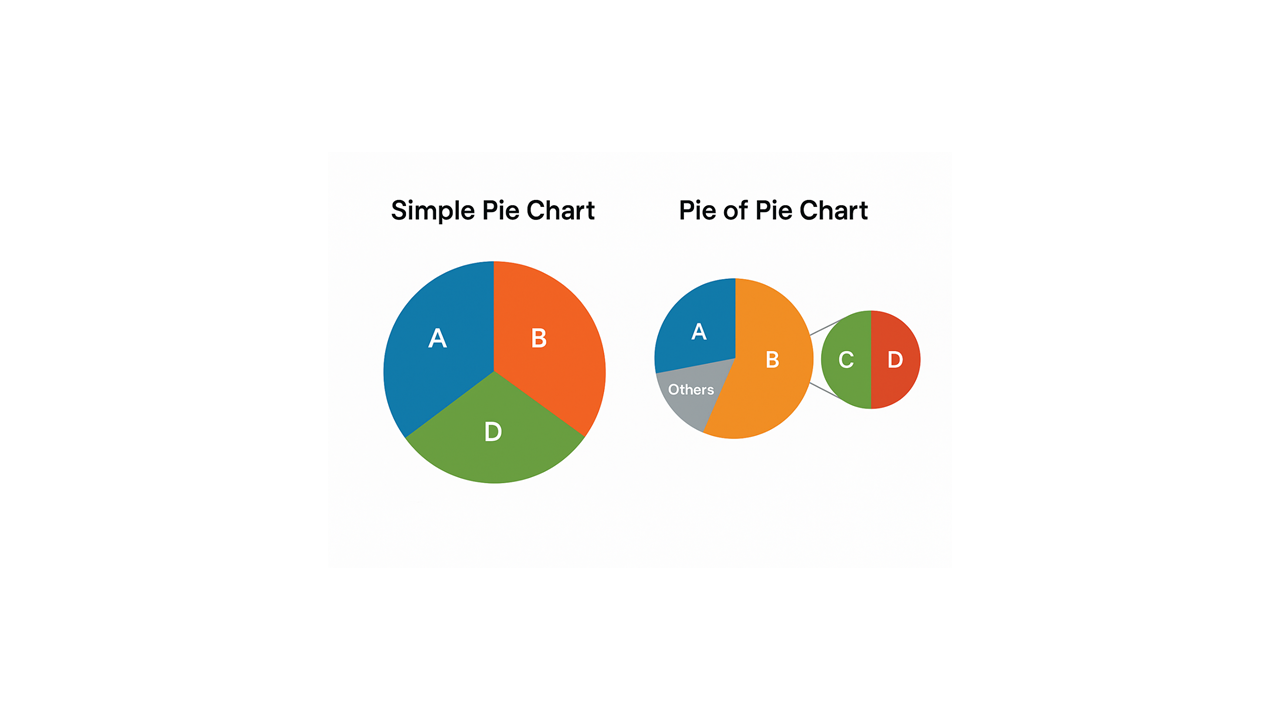
Two important types of pie charts used in thesis and dissertation writing are:
🔹 **1. Simple Pie Chart**
A simple pie chart is a circular diagram divided into segments, where each segment represents the proportion or percentage of a particular category.
✅ **Example:** Distribution of study participants according to blood groups, socioeconomic status, nutritional status or disease severity.
📌 **Best used for:**
- Presenting percentages of a single categorical variable.
- Showing the relative contribution of categories to a total.
- Displaying data with a limited number of categories.
🔹 **2. Pie of Pie Chart**
A Pie of Pie chart consists of a primary pie chart and a secondary pie chart. The secondary chart provides a detailed breakdown of selected categories from the primary chart.
✅ **Example:** Presenting the overall distribution of disease categories, with a secondary pie chart showing the distribution of less common disease subtypes.
📌 **Best used for:**
- Highlighting smaller categories that are difficult to distinguish in a simple pie chart.
- Providing a more detailed breakdown of selected categories.
- Presenting subgroup distributions without overcrowding the main chart.
🎯 **Important Tips for Thesis and Dissertation Writing**
✔ Use pie charts primarily for categorical variables.
✔ Ensure that all categories are mutually exclusive and collectively account for 100% of the observations.
✔ Display percentages clearly, preferably alongside category names.